Compact binary coalescence parameter estimation
In this example, we demonstrate how to generate simulated data for a binary black hole coalescence observed by the two LIGO interferometers at Hanford and Livingston for all parameters in the IMRPhenomPv2 waveform model.
The code will take around 8 hours to run.
For testing, you may prefer to run the 4-parameter CBC tutorial.
  1#!/usr/bin/env python
  2"""
  3Tutorial to demonstrate running parameter estimation on a full 15 parameter
  4space for an injected cbc signal. This is the standard injection analysis script
  5one can modify for the study of injected CBC events.
  6
  7This will take many hours to run.
  8"""
  9import bilby
 10from bilby.core.utils import random
 11
 12# Sets seed of bilby's generator "rng" to "123" to ensure reproducibility
 13random.seed(123)
 14
 15# Set the duration and sampling frequency of the data segment that we're
 16# going to inject the signal into
 17duration = 4.0
 18sampling_frequency = 1024.0
 19
 20# Specify the output directory and the name of the simulation.
 21outdir = "outdir"
 22label = "full_15_parameters"
 23bilby.core.utils.setup_logger(outdir=outdir, label=label)
 24
 25
 26# We are going to inject a binary black hole waveform.  We first establish a
 27# dictionary of parameters that includes all of the different waveform
 28# parameters, including masses of the two black holes (mass_1, mass_2),
 29# spins of both black holes (a, tilt, phi), etc.
 30injection_parameters = dict(
 31    mass_1=36.0,
 32    mass_2=29.0,
 33    a_1=0.4,
 34    a_2=0.3,
 35    tilt_1=0.5,
 36    tilt_2=1.0,
 37    phi_12=1.7,
 38    phi_jl=0.3,
 39    luminosity_distance=2000.0,
 40    theta_jn=0.4,
 41    psi=2.659,
 42    phase=1.3,
 43    geocent_time=1126259642.413,
 44    ra=1.375,
 45    dec=-1.2108,
 46)
 47
 48# Fixed arguments passed into the source model
 49waveform_arguments = dict(
 50    waveform_approximant="IMRPhenomXPHM",
 51    reference_frequency=50.0,
 52    minimum_frequency=20.0,
 53)
 54
 55# Create the waveform_generator using a LAL BinaryBlackHole source function
 56# the generator will convert all the parameters
 57waveform_generator = bilby.gw.WaveformGenerator(
 58    duration=duration,
 59    sampling_frequency=sampling_frequency,
 60    frequency_domain_source_model=bilby.gw.source.lal_binary_black_hole,
 61    parameter_conversion=bilby.gw.conversion.convert_to_lal_binary_black_hole_parameters,
 62    waveform_arguments=waveform_arguments,
 63)
 64
 65# Set up interferometers.  In this case we'll use two interferometers
 66# (LIGO-Hanford (H1), LIGO-Livingston (L1). These default to their design
 67# sensitivity
 68ifos = bilby.gw.detector.InterferometerList(["H1", "L1"])
 69ifos.set_strain_data_from_power_spectral_densities(
 70    sampling_frequency=sampling_frequency,
 71    duration=duration,
 72    start_time=injection_parameters["geocent_time"] - 2,
 73)
 74
 75ifos.inject_signal(
 76    waveform_generator=waveform_generator, parameters=injection_parameters
 77)
 78
 79time_delay = ifos[0].time_delay_from_geocenter(
 80    injection_parameters["ra"],
 81    injection_parameters["dec"],
 82    injection_parameters["geocent_time"],
 83)
 84
 85injection_parameters["H1_time"] = injection_parameters["geocent_time"] + time_delay
 86
 87# For this analysis, we implement the standard BBH priors defined, except for
 88# the definition of the time prior, which is defined as uniform about the
 89# injected value.
 90# We change the mass boundaries to be more targeted for the source we
 91# injected.
 92# We define a prior in the time at the Hanford interferometer
 93priors = bilby.gw.prior.BBHPriorDict()
 94
 95priors["H1_time"] = bilby.core.prior.Uniform(
 96    minimum=injection_parameters["H1_time"] - 0.1,
 97    maximum=injection_parameters["H1_time"] + 0.1,
 98    name="H1_time",
 99    latex_label="$t_H$",
100    unit="$s$",
101)
102
103# Initialise the likelihood by passing in the interferometer data (ifos) and
104# the waveoform generator, as well the priors.
105# The explicit distance marginalization is turned on to improve
106# convergence, and the posterior is recovered by the conversion function.
107likelihood = bilby.gw.GravitationalWaveTransient(
108    interferometers=ifos,
109    waveform_generator=waveform_generator,
110    priors=priors,
111    distance_marginalization=True,
112    phase_marginalization=False,
113    time_marginalization=False,
114    reference_frame="H1L1",
115    time_reference="H1",
116)
117
118# Run sampler. In this case we're going to use the `dynesty` sampler
119# Note that the `nlive`, `naccept`, and `sample` parameters are specified
120# to ensure sufficient convergence of the analysis.
121# We set `npool=16` to parallelize the analysis over 16 cores.
122# The conversion function will determine the distance posterior in post processing
123result = bilby.run_sampler(
124    likelihood=likelihood,
125    priors=priors,
126    sampler="dynesty",
127    nlive=1000,
128    naccept=60,
129    sample="acceptance-walk",
130    npool=16,
131    injection_parameters=injection_parameters,
132    outdir=outdir,
133    label=label,
134    conversion_function=bilby.gw.conversion.generate_all_bbh_parameters,
135    result_class=bilby.gw.result.CBCResult,
136    rstate=random.rng,
137)
138
139# Plot the inferred waveform superposed on the actual data.
140result.plot_waveform_posterior(n_samples=1000)
141
142# Make a corner plot.
143result.plot_corner()
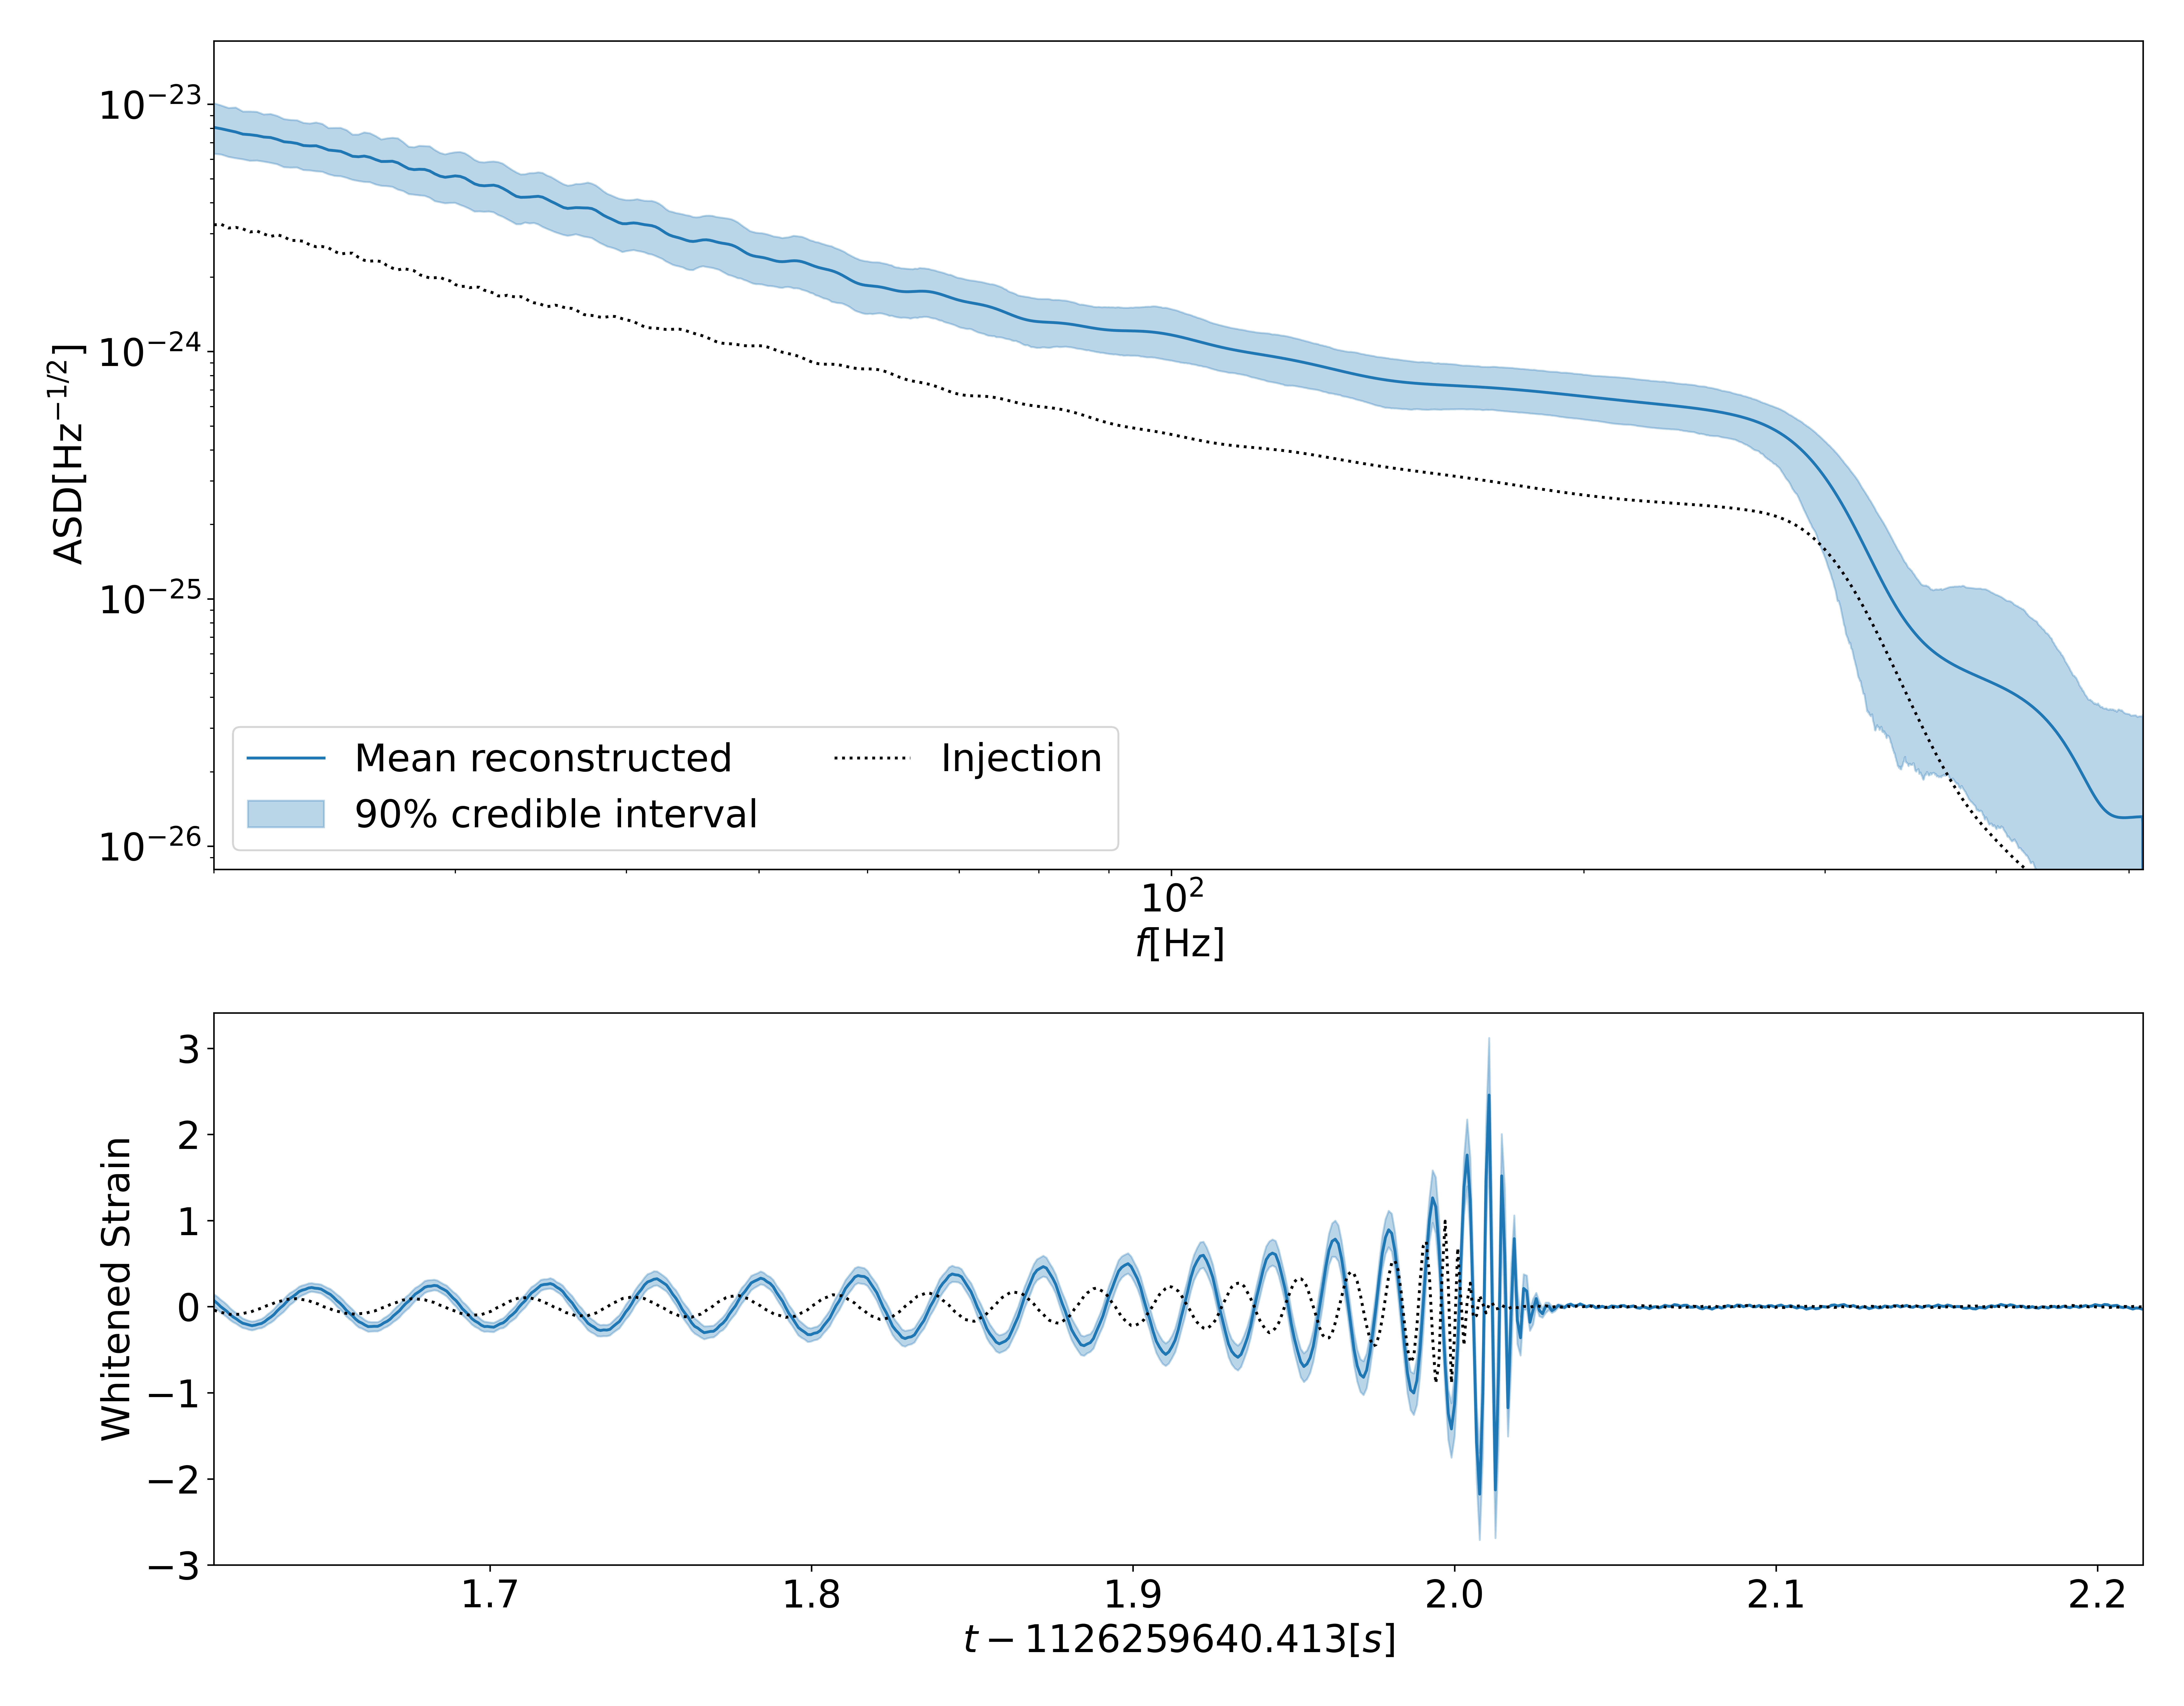
Running this script will generate data then perform parameter estimation. In doing all of this, it prints information about the matched-filter SNRs in each detector (saved to the log-file). Moreover, it generates a plot for each detector showing the data, amplitude spectral density (ASD) and the signal; here is an example for the Hanford detector:

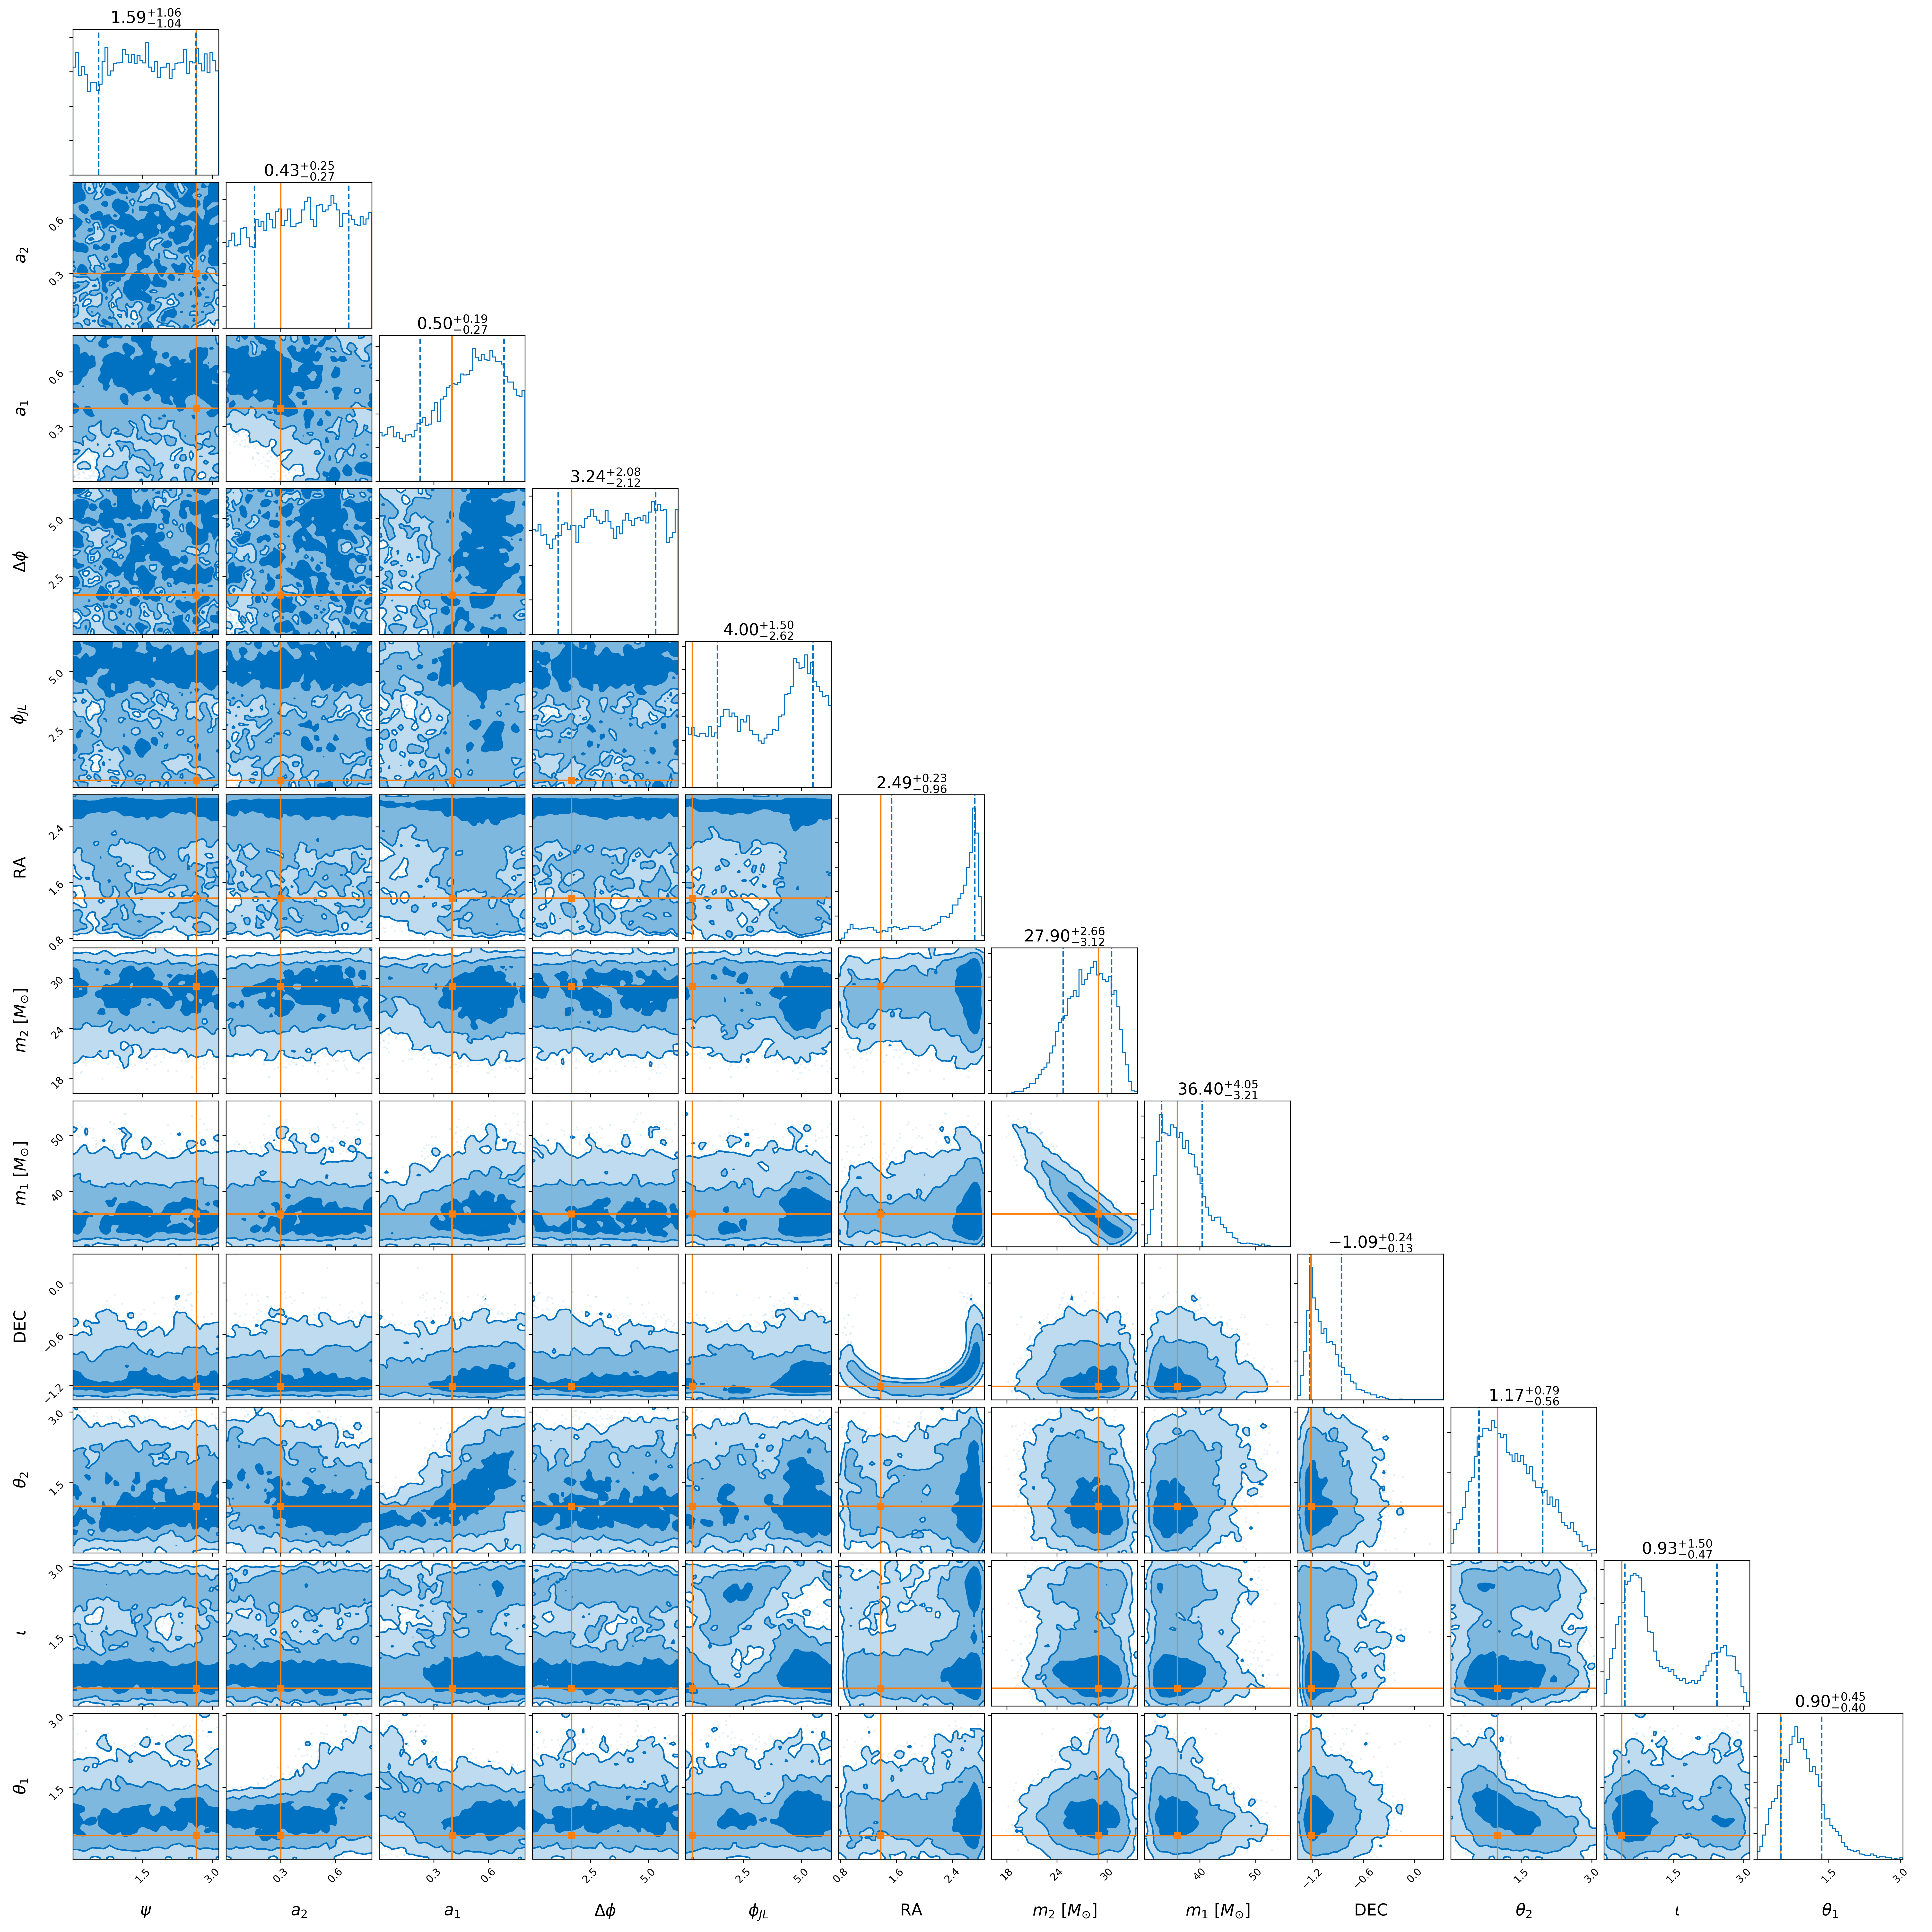
Finally, after running the parameter estimation. It generates a corner plot:

The solid lines indicate the injection parameters.